|
|
This article was published in Danish, in the Danish radio armature magazine "OZ" in July 2009
|
|
20 Dollars Spectrum Analyzer.
By Thomas Gosvig OZ1JTE, 2750 Ballerup.
|
|
|
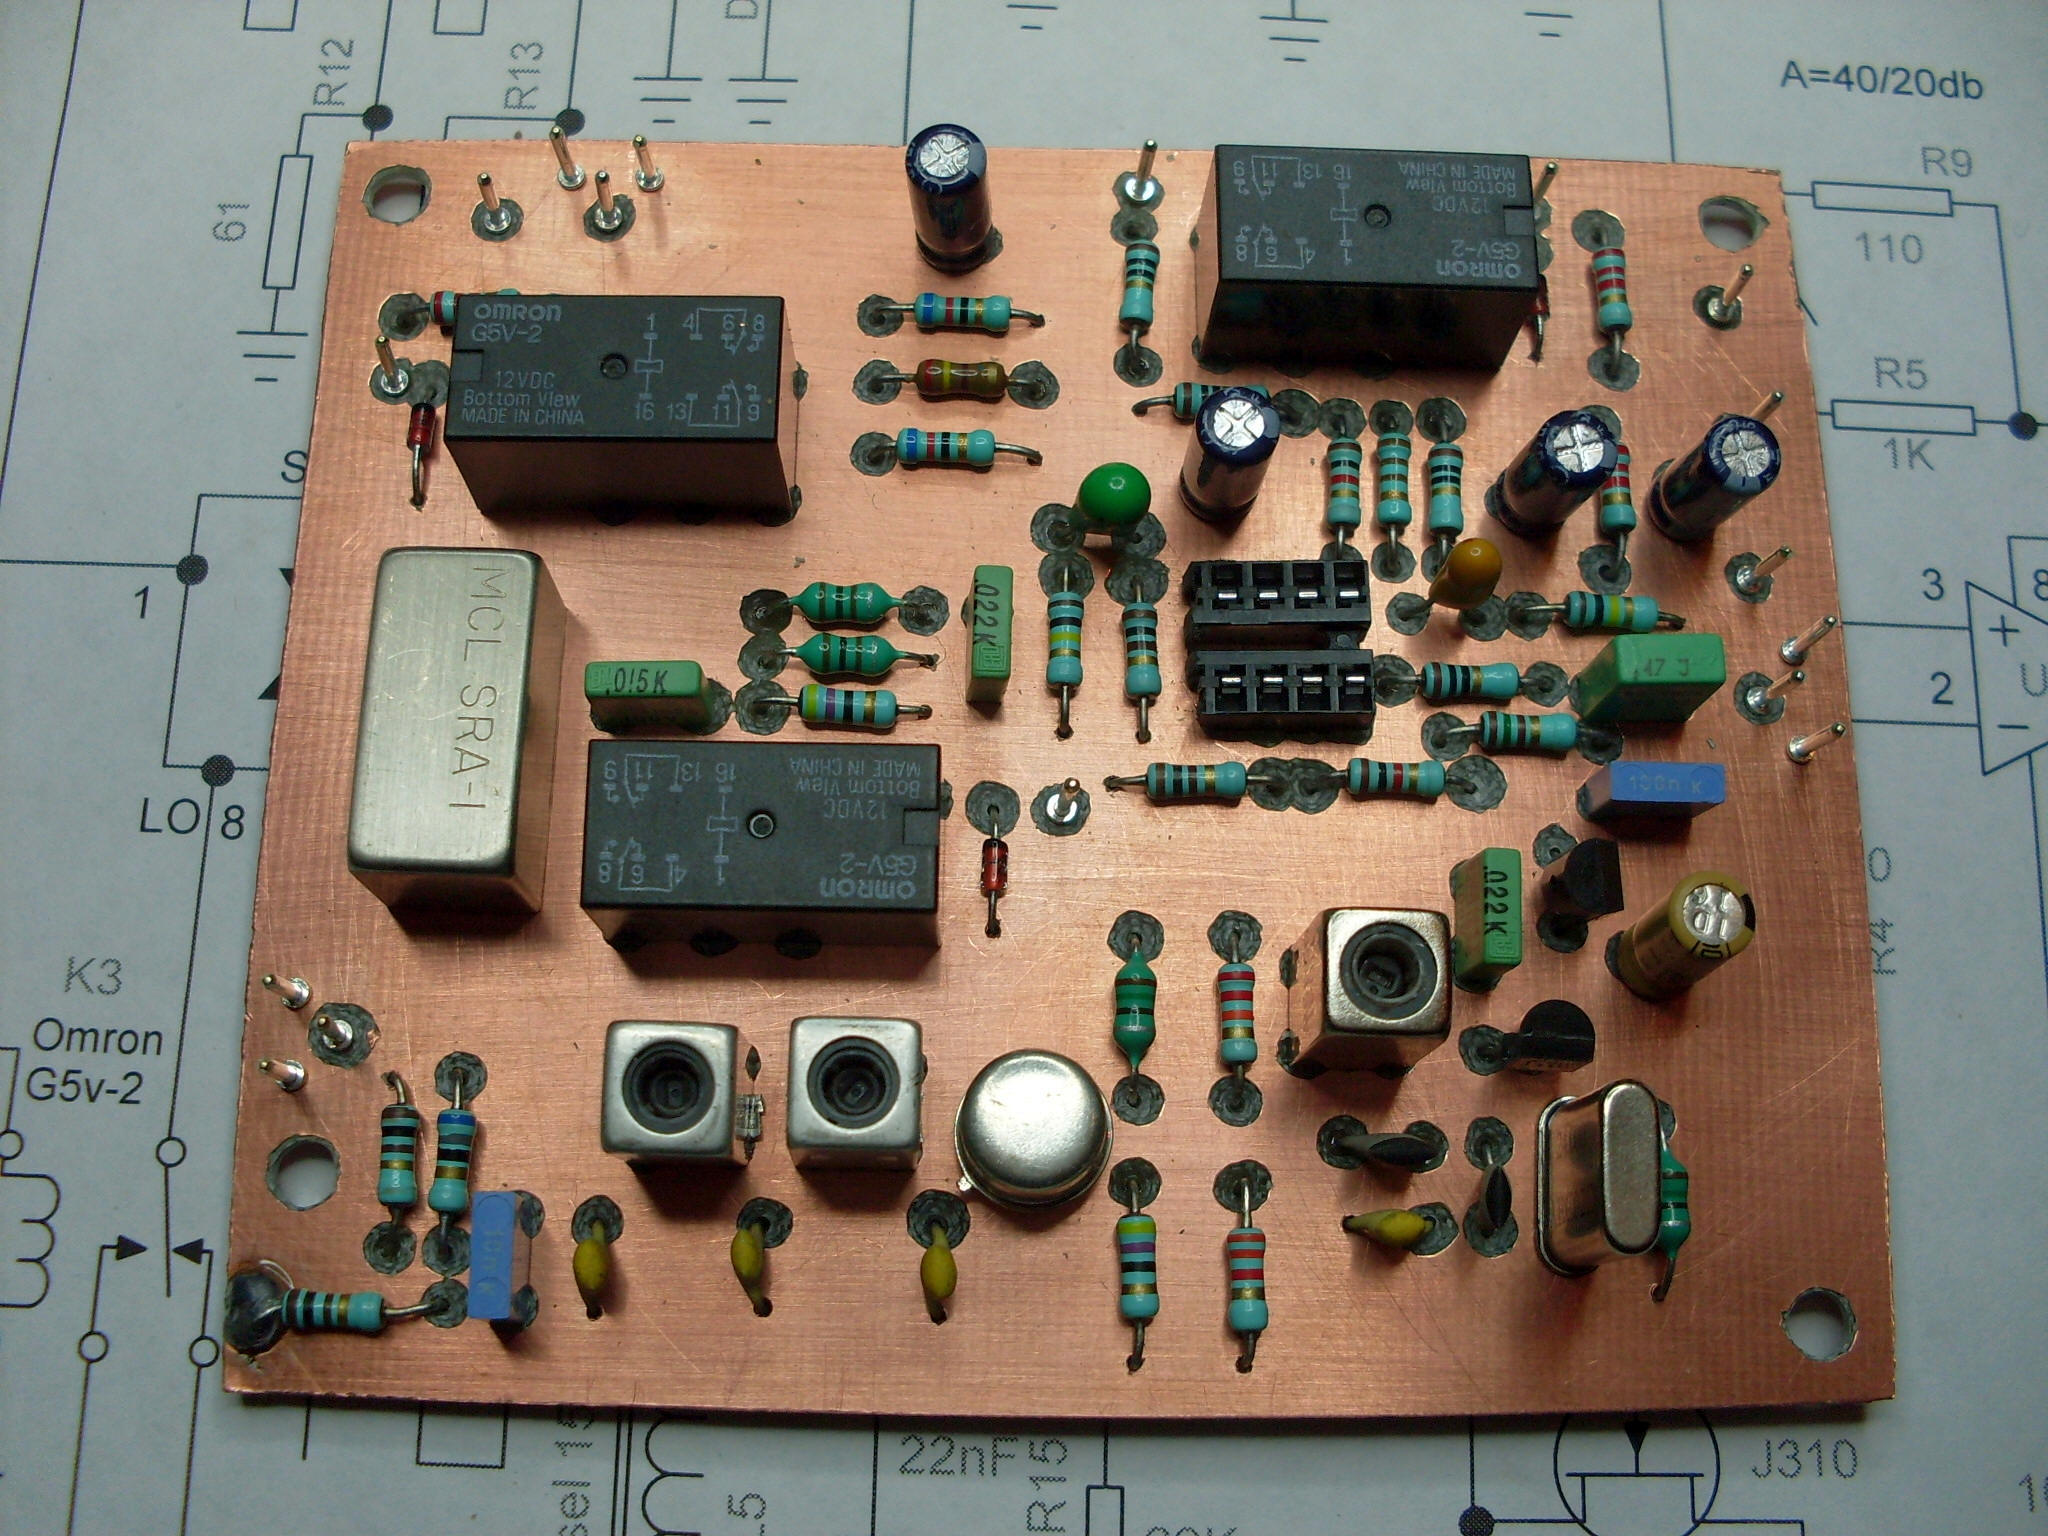
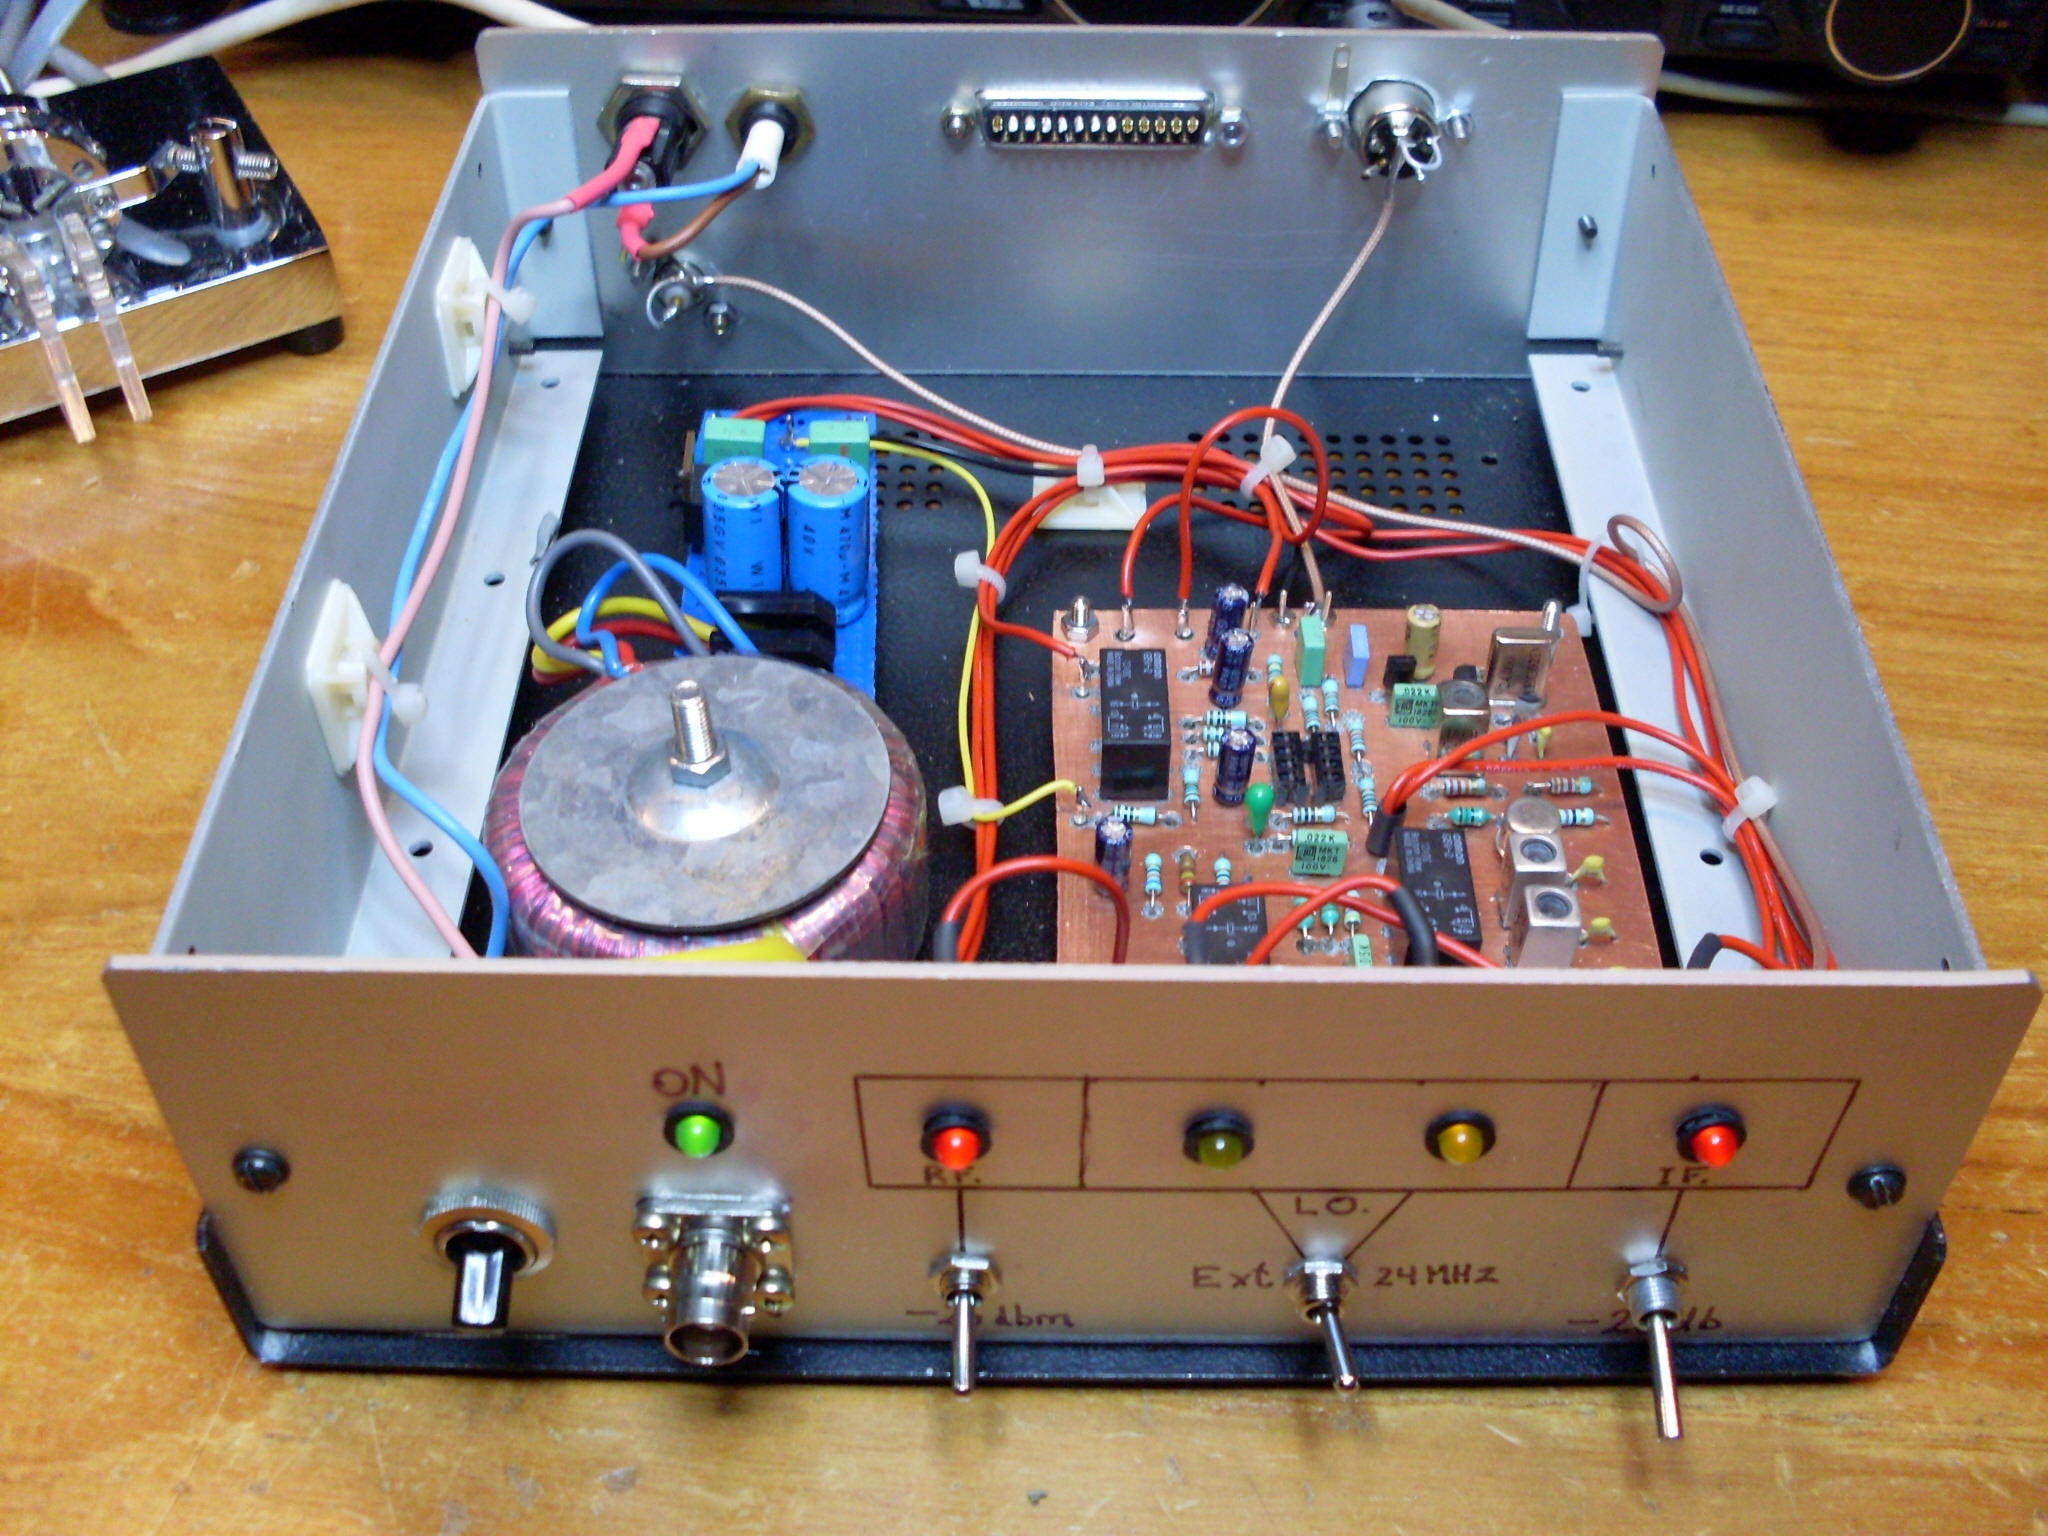
| Figur 1. PCB ready to use | Figur 2. The final construction |
Some time ago I was in a need for measurement of some very small signals
in a HF transceiver. That gave me the idea to design and built this little unit.
The unit seems to be a very good supplement for the test equipment I already had
in my workshop.
When I was designing the unit I was very much in doubts of the ability
of this unsophisticated design.
I know this isn’t rocket science, but nevertheless I quickly realized
that I had made a very useful piece of test equipment, that gave me the
opportunity to study signals from many different signal sources. I could now
look at modulation, look at very weak signals and also IMD was a opportunity to
study.
As a little bonus, I also realizes that I had made a pretty effective
SDR radio.
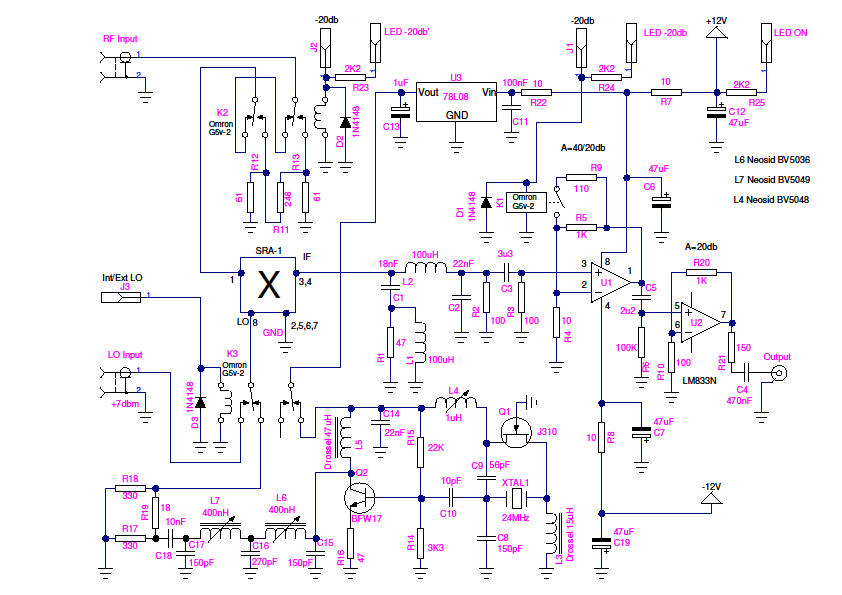
You can see the PCB board at figure 1. At figure 10 you can see the
schematic.
What I
wanted was to take advantage of the very nice, and also very impressive audio
spectrum analyzer software you can find in the Internet.
Many of
these software solutions has anything you need for analyze an audio signal.
Because
this kind of software works in a very close teamwork with the computer
soundcard, then all of them is limited of the speed and bandwidth of the
soundcard.
A
typical soundcard are able to cover from 10 Hz to 30 KHz in a single sweep.
Some
soundcard are way better, and of cause these card will give you even more
bandwidth.
Not bad
at all when we are talking audio signals, but maybe not that impressive if this
was a part of a HF band, but nevertheless it would be very useful to have when
you try to look at some selected signals.
Maybe
you have head something similar to this text and this is because my text also
could be the beginning of a software defined radio article.
But I
was not really in a need for a SDR radio and I thought that the design could be
even more simple then a SDR radio for covering my needs. This is what I came up
with.
At
figure 2 you see the final construction.
The
software I chose was the SpectraVue.
|
|
Fig 10 Schematic
|
|
|
|
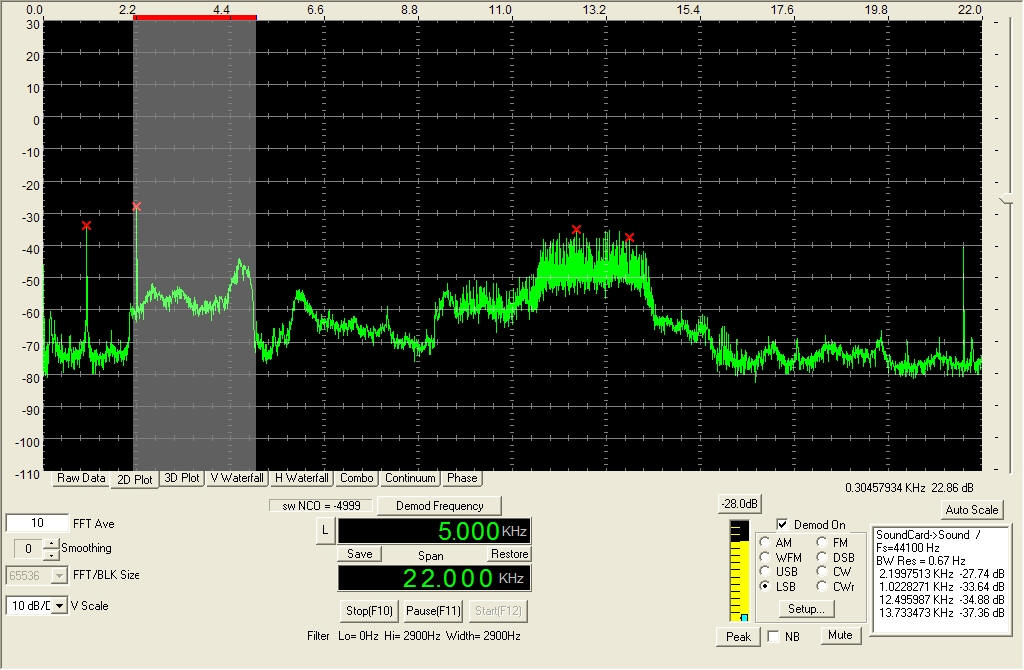
Fig 3 3.770 KHz reception and heavy QRM |
Fig 4 3.770 KHz without QRM. Now LO 3.765 KHz |
The details.
The
heart of this project is a Double Balanced frequency Mixer. I have chosen the
SRA-1. This mixer is a standard mixer and can easily be replaced by most of the
other pin compatible mixer types.
Most of these mixer types have pretty
similar specifications.
(HPF-505, SBL-1, IE-500, IE-800).
The
working frequencies for these mixers are 0.5-500 MHz, and all ports are 50 Ohm.
You could simplify the input and output
port of this mixer to one antenna port, one local ocsilliator (LO) port and one
IF port (output).
If we
inject a LO signal of 14.000 MHz to
the mixer, then a antenna signal of 14.020 MHz will be converted to a 20 KHz
signal.
We now
have a signal on the IF port that is at a sufficient low frequency that it will
be usable for our soundcard and spectrum analyzer software.
The
conversion loss of this kind of mixers is about 6 dB.
Because
of this and because other signals we also have interest for normally are very very
small, then I have a opamp placed after the mixer to give the signal a needed
boost. Then we are sure the size of the signal is big enough to overcome the
noise floor of the soundcard.
A quiet
OpAmp that have a good noise figure and low distortion is necessary for good
results.
These
types of mixer I use are very easy to work with but a few disadvantages are
things we have to deal with.
In the
above example the wanted frequency to measure ended up as 20 KHz but also the
sum of the antenna signal and the LO signal (14000+14020) will be present at the
IF output of the mixer. This is a
unwanted signal.
These
mixers are a little hysterical about the impedance on the input and output
ports.
Therefore the filter I have placed after the IF output have a diplexer that will
terminate all of the unwanted signals into a 50 Ohm load. The unwanted signals
are as I described, the signals sum or upper sideband.
.
|
|
Fig 12 Component Layout
|
|
|
|
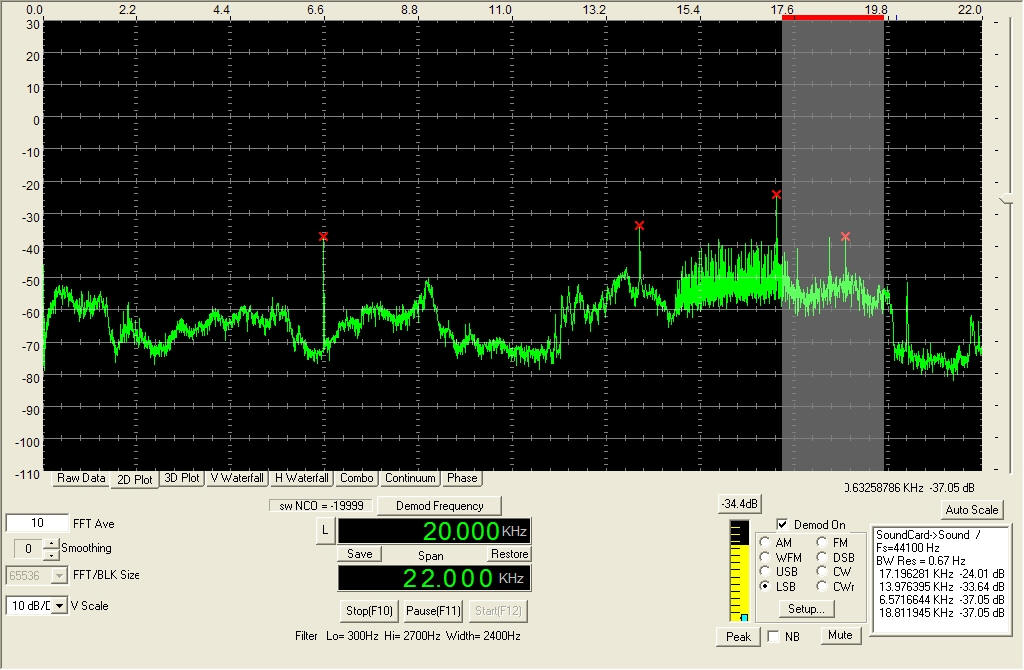
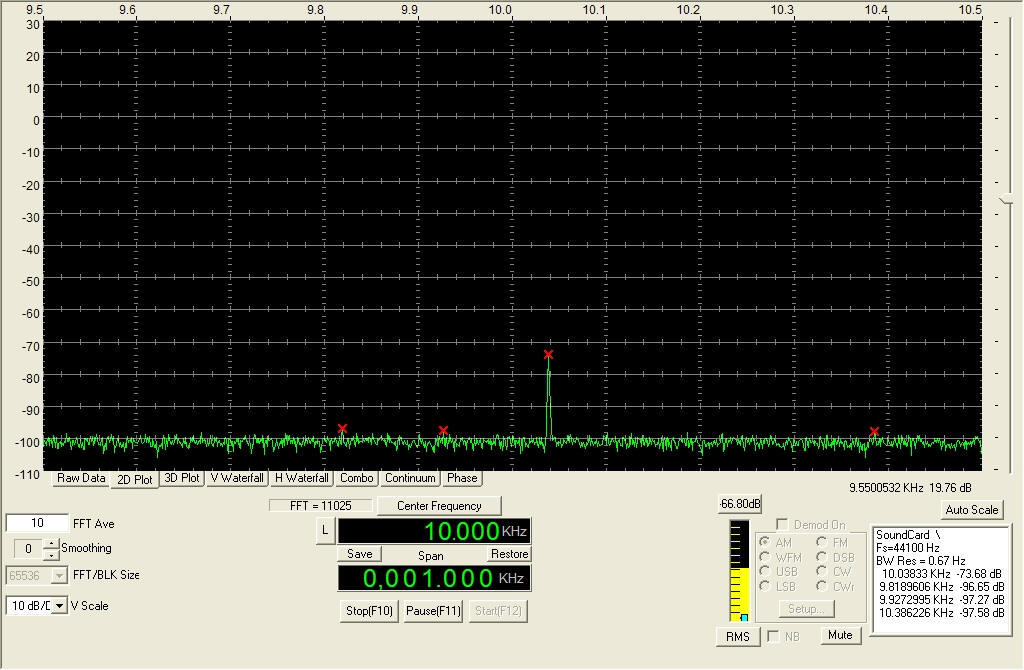
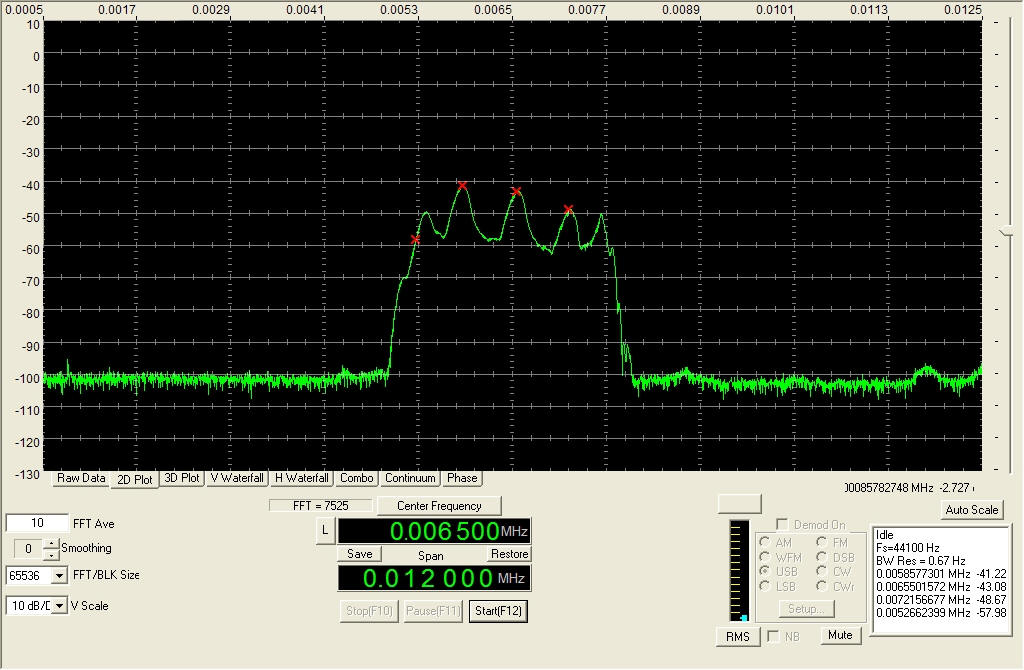
Fig. 5 The -115 dBm signal shows easily. |
Fig 6 AM signal 500 Hz tone and 80% modulation |
Some limitations.
This is
not the perfect world so therefore we also have some limitations in this system.
It is
easy to overload the input and hereby get some distortion from the mixer and
OpAmp itself.
Because
of that I have placed an opportunity to take the last 20 dB of the gain in the
OpAmp. So instead of the normal 60 dB we can also chose 40 dB.
We can
also use a 20 dB RF attenuator in front of the mixer to insure an undistorted
output from our mixer.
Another
limitation we will observe is the lack of frequency mirror suppression.
If we as
an example want to see a signal at 3770 KHz then we could chose our LO frequency
to be 3760 KHz and hereby get a output for our soundcard at 10 KHz.
In this
above example we will observe that also a signal at 3750 KHz will end up as a
signal at 10 KHz.
I have
found this not to be a big problem because this unit is mainly thought as a test
equipment, and most of the time there will never be another signal present
exactly at the mirror frequency at the same time.
But if
you want to use this unit as a SDR radio then from time to time you will notice
this above problem because a LO signal as above will give just a good reception
on 3,770 MHz LSB as 3.750 USB.
When you
work with this in practice you will notice that this isn’t of great concern
after all if you are able to vary the LO signal source. Then you just chose
another LO signal to give another decoding frequency in the spectrum span (1-30
KHz) and then the problem is solved. Then the annoying mirror signal will be far
away from our decoding frequency.
But of
cause this is a matter you have to live with if you use this unit as a SDR
radio.
|
|
|
 |
|
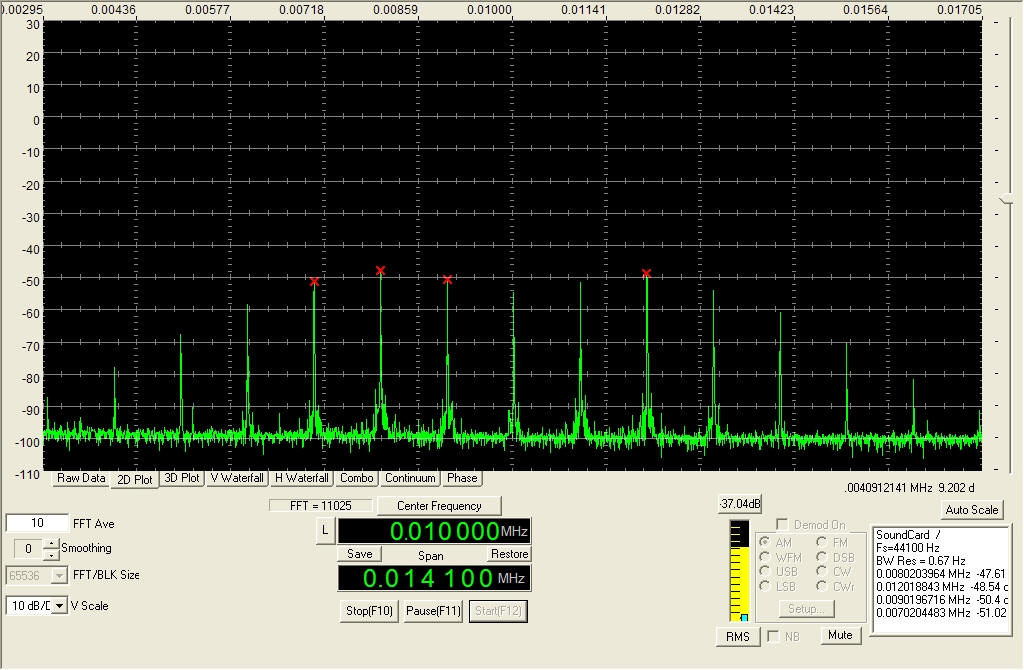
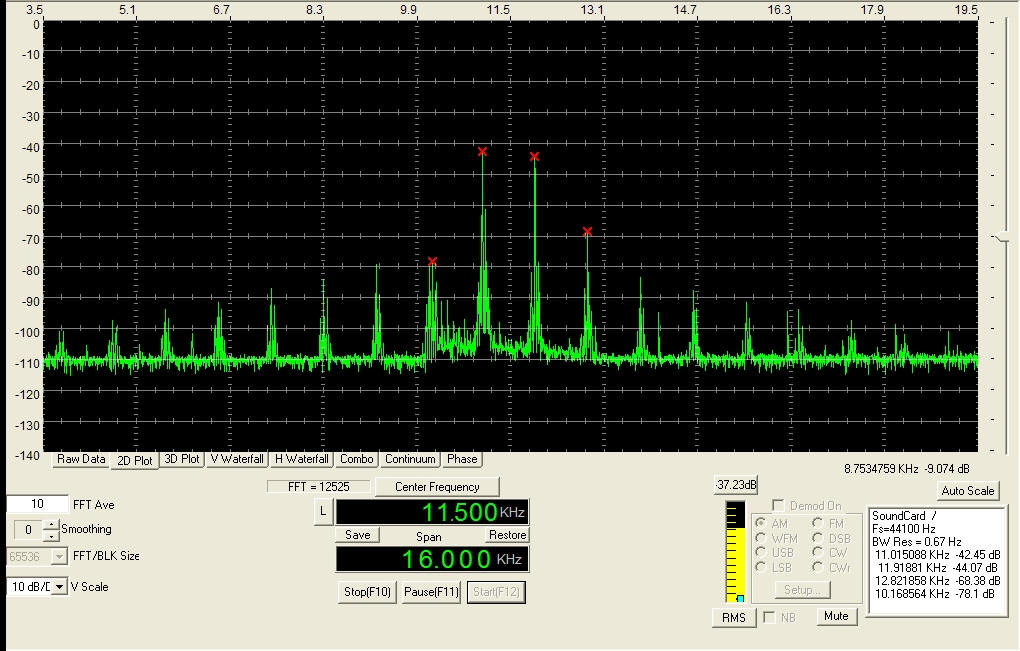
Fig. 7 FM signal 1 KHz tone and 3 KHz deviation. |
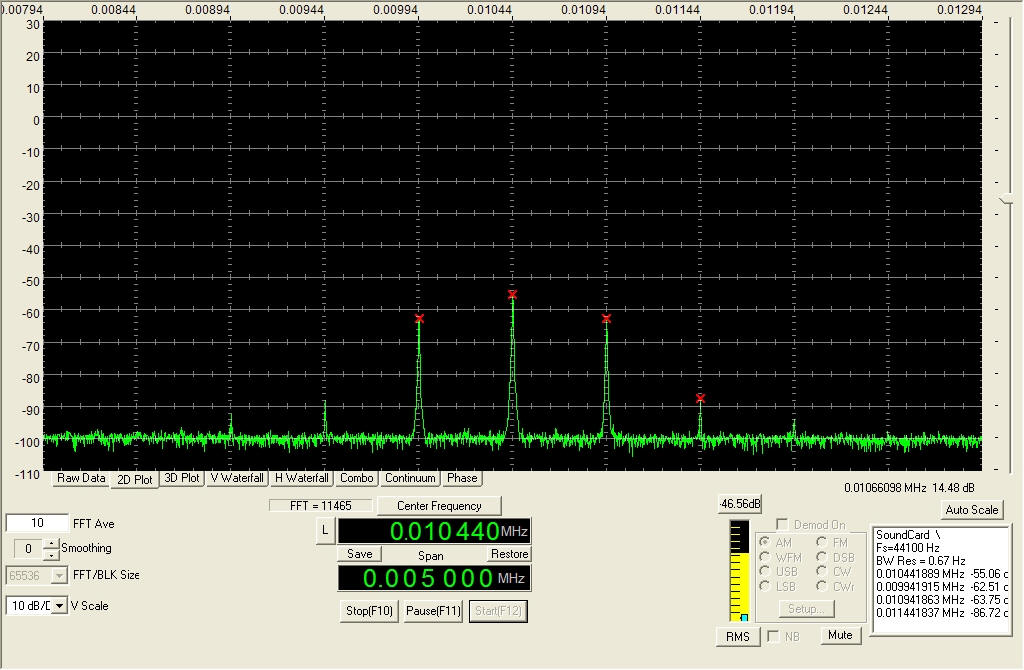
Fig. 8 Two tone test shows IMD from IC-746 |
Fig. 9 Sweep of a 1.4 MHz crystal filter. |
As already described this is mainly
thought as a piece of test equipments for you workshop and not a SDR radio, and
what will this unit do for you then?
To get
the most fun out of the package then you should have a adjustable signal
generator as a LO source.
This
frequency source will determine at with frequency’s you are able to look at and
to measure.
Signal
sources as Xtal oscsilliators, miniVNA’s, or a RF generator will all do.
Even an
old Grid dip meter or simple antenna analyzers should also be ok for the job.
My
minivan and my RF generator seem to be very useful.
Nevertheless I have also made room for a Xtal oscillator on the pcb.
This
X-tal will give you a clean and useful LO signal for the mixer, if you not have
any of the above signal sources.
This
will only give you one choice of frequency, and make the system less flexible.
If you
do have one of the adjustable signal generators then this X-tal oscillator is
quite useful anyway, because you will have the ability to calibrate the input
level indicator at the spectrum analyzer software when you use your known input
level from your RF generator.
The
components around the X-tal oscillator are for a 24 MHz X-tal. (plus/minus some
MHz).
I have
made my coils myself, but I have listed some Neosid coils as I think will do.
The LO
input level for the mixer should be +3 to +7 dBM (0.9Vpp to 1.4Vpp) for best
results. The level can be adjusted using the attenuator R17-R19.
When the
system is complete and you have chosen a frequency to measure, then signals down
to about -120 dBm should be seen without any problems.
Figure 5
shows a -115 dBm signal very easily.
+120 dBm
is 0.224 uV. Your oscilloscope gave up when your signal was about -40 dBm.
All the
different type of modulation can now be viewed and evaluated.
Figure 6
shows a AM signal. The sidebands are easily seen. 80% modulation and 500 Hz
audio tone.
At
figure 7 you can se a FM signal. 1 KHz audio tone and deviation is 3 KHz.
The
level of both the AM and FM signal are -73 dBm. This is S-9 at HF.
Maybe it
gets a bit more interesting when the setup is lined up for
IMD testing of your homebrew
power amplifier. (Intermodulation distortion).
When I
used the Dgen software from DL6IAK I was able to run my Icom IC-746 for full
power in a two-tone test, and after making a -40 dB tab on my dummyload I was
now able to see the IC-746 IMD directly at the spectrum analyzer software.
Figure 8
shows the result. The 23 dB IMD was quite accurate when comparing my result to a
more professional line up of test equipment.
The
drawback with my own simple system, when you make a two-tone test like this one,
is the amount of noise in the spectrum. This is caused by spurious signals from
the 3. Harmonic from both the Input signal and the LO signal that also meets in
the mixer and makes these spurious frequencies.
My last
examble is figure 9. This picture shows a sweep of a 1.4 MHz SSB crystal filter.
As you can see the ripple in the filter is very high, but I am sure this is
caused by the simple connection to 2 pieces of 50 Ohms coax cable, and without
any kind of real impedance termination at all.
.
The
printed circuit board is not critical at all. Most of the signals are at low
frequencies.
My own
board is made out of double sided pcb and I use one side as ground only.
I am
pretty sure that a single sided pcb will do the job almost as good as the double
sided board.
Figure
11 shows my PCB layout. Figure 12 shows the components layout.
My good
friend Jens OZ1ARZ has for a long time told me that he always use a little Yaesu
VR-5000 scanner to measure and adjust a lot of his homebrew equibment. He use
the little bar graph inside the scanner display. This way he has 10 LED
dynamic..Hi Hi. I have already told him many times that this sounded hopeless.
You can find the part list here.
 |
| Figur 11. PCB Layout |